State of the (open source) web map
Part I: The base(map)
Background
I feel that we are at a point in time, where browser based webmapping is reaching a position to really help/support geospatial analysts during their complete analysis cycle.
Therefore, in this document, I want to do some rubberducking about the current state of affairs and also highlight gaps that currently still exist. Even though I’m an R guy and most visualization in this document will be made using R, this document is not intended for a specific programming language audience. It aims to provide a general overview of what we currently have and what we still lack.
Also, everything that follows will focus on open source solutions (although there will be the odd mention of closed source projects) and we don’t care about rendering on mobile devices.
Web mapping libraries
Let’s start with a list of currently available web mapping solutions (in no particular order and with no claim on completeness):
- Leaflet - probably the most widely used currently, no WebGL
- Gleo - with an API similar to Leaflet, WebGL
- OpenLayers - solid, with a long history, supports WebGL
- Mapbox* - WebGL
- MapLibre - open source continuation of Mapbox
* used to be open source, not anymore
Of this list, Leaflet is the only one that does not natively support WebGL and as such has serious issues with rendering larger data, though some plugins exist that enable support of WebGL in one way or another. It also does not support vector tiles out of the box, but again, plugins are available. In general, it is probably the web mapping platform with the longest list of third-party plugins. As such, it is a very versatile and feature-rich library and is used extensively all over the web.
I have never used Gleo, hence, listing it here is about as much detail I can give.
Likewise, I have never used OpenLayers, so, again, listing it here is about as much detail I can give.
In fact, the rest of this document will be highly biased and focus heavily on MapLibre.
MapLibre is a fork of the late Mapbox project before it went from open to closed source. It is a feature rich community effort that natively supports both WebGL and vector tiles. It also has a suite of third-party plugins. Additional information is also provided on the Awesome MapLibre list.
Given that all of these solutions are for browser based visualization, they are implemented in either pure JavaScript or TypeScript. Apart from Mapbox, all pre-bundled code is available through the standard CDNs, such as jsDelivr.
All of these libraries provide functionality to render base maps and data layers.
Here’s a standard Leaflet map with the standard OSM basemap with 500 random points rendered as circleMarkers
Background maps
This is the stuff that helps us locate our data in the real world. It mainly serves as a visual reference, but of course it can serve other purposes. It may also serve as a data layer of e.g. OpenStreetMap, as all rendered features may be queryable, depending on data model & zoom levels - more on that later. In some cases, it may also be art, think of e.g. the Stamen Watercolor (now Stadia) basemaps.
Basemaps can be implemented either as raster tiles or vector tiles. MapTiler provides a nice overview of the differences between the two formats.
Raster tiles
“Raster tiles are square bitmap graphics displayed in a grid arrangement to show a map. […] Map tiles are typically 256×256 pixel images. […] Tiles are not always in these dimensions; for example there could be 64×64 pixel images, however 256×256 pixel images are a de facto standard. 512×512 pixel seems to be the usual size of high-resolution tiles. A”tileset” typically includes enough tiles to form a very large image, if they were shown all at once, and also several zoom levels. Generally the idea is not to show them all at once, but to display a particular area of the map on a website. Normally this is done using a JavaScript map library to provide panning and zooming functionality, and request downloading of new tiles as necessary to show the user new areas of the map (a Slippy Map).”
OpenStreetMap Raster tile wiki
The OSM background map in the example above is a raster tile based map and fetches the respective tiles (depending on extent and zoom) from the dedicated raster tile server at the time of rendering, e.g. for {z}oom level 2 we have 4x4 tiles available (here we show all tiles {x} = 0-3 of the second row from top - {y} = 1)
The url is constructed as https://tile.openstreetmap.org/{z}/{x}/{y}.png (the last part is shown under each tile).
/2/0/1.png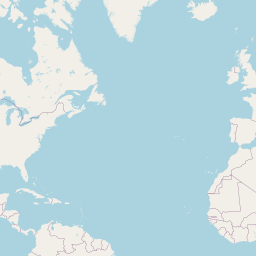
/2/1/1.png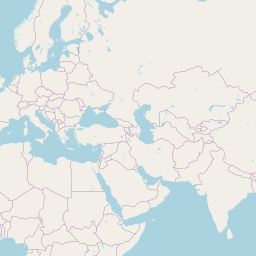
/2/2/1.png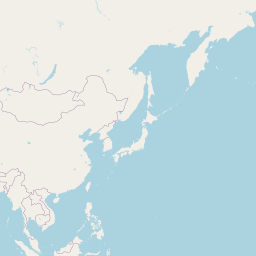
/2/3/1.pngThere are many raster tile providers, some free, some commercial. See e.g. here or here for examples.
Leaflet is made for raster tile background maps, but vector tile plugins do exist.
Vector tiles
MapLibre uses vector tiles natively for rendering basemaps. So let’s explore this a little.
“Vector tiles are a way to deliver geographic data in small chunks to a browser or other client application. Vector tiles are similar to raster tiles, but instead of raster images, the data returned is a vector representation of the features in the tile. Clients must then render the data into a visual representation on the fly, typically with the help of a separate stylesheet that describes how the data should look when it is presented to the user.”
OpenStreetMap Vector tile wiki
Vector tiles are almost always delivered in the Mapbox Vector Tiles or MVT file format, which is defined in the Mapbox Vector Tile Specification. There are alternatives, such as MBTiles and PMTiles which enable storing tile sets in a single file rather than a folder hierarchy. We’ll cover these formats in more detail in a later part when we talk about overlays.
Tile schemas specify what data is provided by the tiles (where the detail generally depends on the zoom level). Different schemas are available, see the Tile schemas section in the OpenStreetMap Vector tile wiki for a list and some more details on those.
Stylesheets generally follow the Mapbox Style Specification, though there are variants evolving independently, such as the MapLibre Style Spec. There are some truely open styles, e.g. those provided by Carto or OpenFreeMap. OpenMapTiles has a more comprehensive catalogue of styles, but they can only be used with a access token/key.
All in all, vector tiles have a few distinct advantages over raster tiles:
- vector data is only downloaded once (and only for the current view), and then the styling is done on the client side (i.e. our browser) on the fly, meaning that we don’t need further downloads when we want to change the basemap style.
- vector tiles can be queried for their attributes, so we get that practically for free, yay!
- vector tiles are scale-independent, meaning that fractional zooms work nicely and the zooming experience in much smoother than for raster tiles, which usually jump from one leven to another.
- vector tiles should generally load faster, as they are usually smaller than comparable raster tiles. A blog post by GIS Cloud investigated benchmarks of raster vs. vector tiles in which they conclude:
“From this benchmark we can notice significant difference between resources needed to produce vector and raster tiles. Not only that with vector technology it is possible to produce more tiles per second, the size of those tiles is significantly lower and therefore less bandwidth is needed. Vector GIS technology that provides such performance can enable true desktop GIS experience in a browser and open up possibilities for having more and more GIS tools on the web.”
Realtime Map Tile Rendering Benchmark: Vector tiles vs. Raster tiles
Let’s see it!
Here’s a MapLibre map with a few things that show the potential of using vector tiles:
- a drop down menu to select different styles (bottom-right). You’ll notice that re-styling happens pretty much instantly (even though we load the styles from a remote location).
- a globe control button to switch between mercator and globe view (top-right).
- an inspect button to switch between standard “show-basemap” and “inspect-basemap” mode. In inspect mode vector tile attributes are queried and shown in a tooltip (top-right). This functionality is provided by the maplibre-gl-inspect plugin.
- we also show the tile boundaries (in red).
- we also have a bearing/pitch control button to reset the map to
north&zero-pitch.
Especially for global data, the option to switch the view from webmercator to a globe is really useful, as we get rid of the distortions inherent in webmercator. But what if we want to see all the global data at once? A globe will only allow us to view parts of the data at a time… which brings us right to the topic of projections, and why they matter.
Projections matter
To be clear, we won’t go into much detail here and focus only on the bits that are relevant for web mapping. The interested reader is referred to proj.org or spatialreference.org for detailed information about (geo)spatial projections and spatial coordinate reference systems.
Just like the Leaflet and MapLibre examples above, pretty much all current implementations of web mapping platforms are based on the web mercator projection which is (IIUC) great for web mapping and slippy maps because it’s a square representation of the earth and as such it can be (sub)divided into equal areas for each zoom level.
More recently, most notable web mapping libraries (apart from Leaflet) also provide an option to project data onto an interactive globe (as highlighted in the MapLibre example above).
From an analysis point of view, web mercator may, however, not be an ideal projection to use. Therefore, it would be great to be able to have at least a set of different options, such as equal earth.
Mapbox offers a set of projections out of the box, but to my knowledge is currently the only platform to do so. Others have dedicated plugins like Proj4Leaflet, but these are tedious to set up and normally lack basemap support. Most freely available basemap providers serve webmercator tiles.
I actually wanted to show some Mapbox maps with different projections here, but it turns out, this is (currently) not possible, due to a combination of licensing restrictions and quarto (or better htmlwidgets) not supporting online dependencies. See this issue for details.
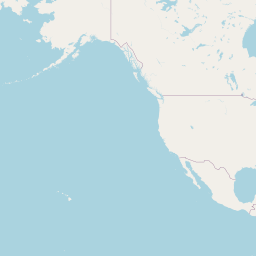
Hence, we’ll have to make do with some static images to get an impression of what Mapbox supports in terms of global projections.
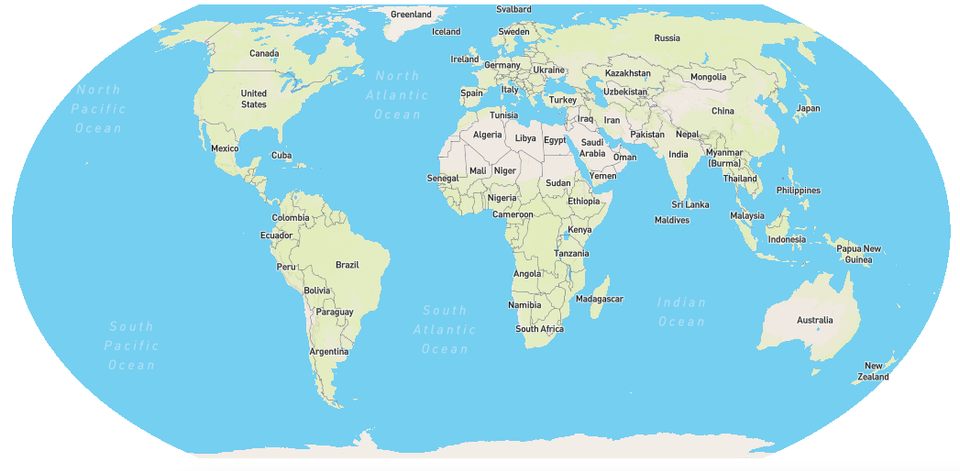
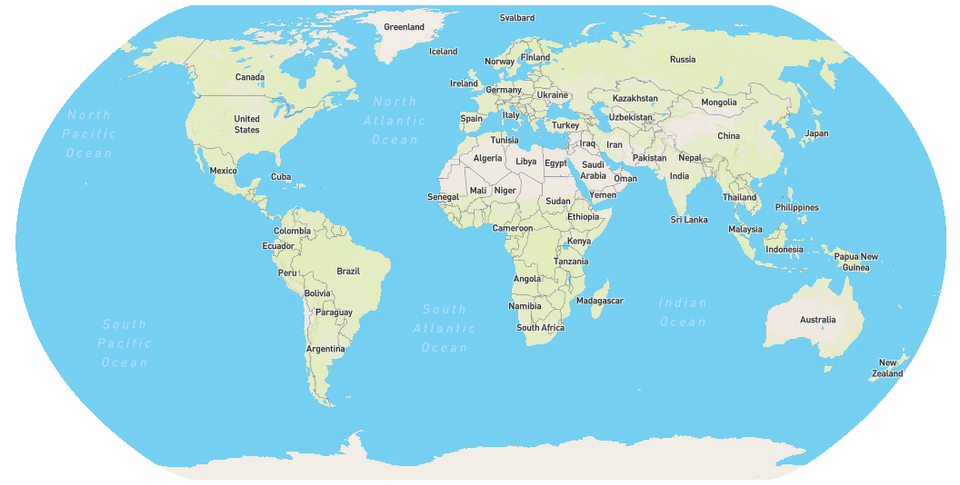
As mentioned above, Mapbox has a nice overview page about all the projections they support.
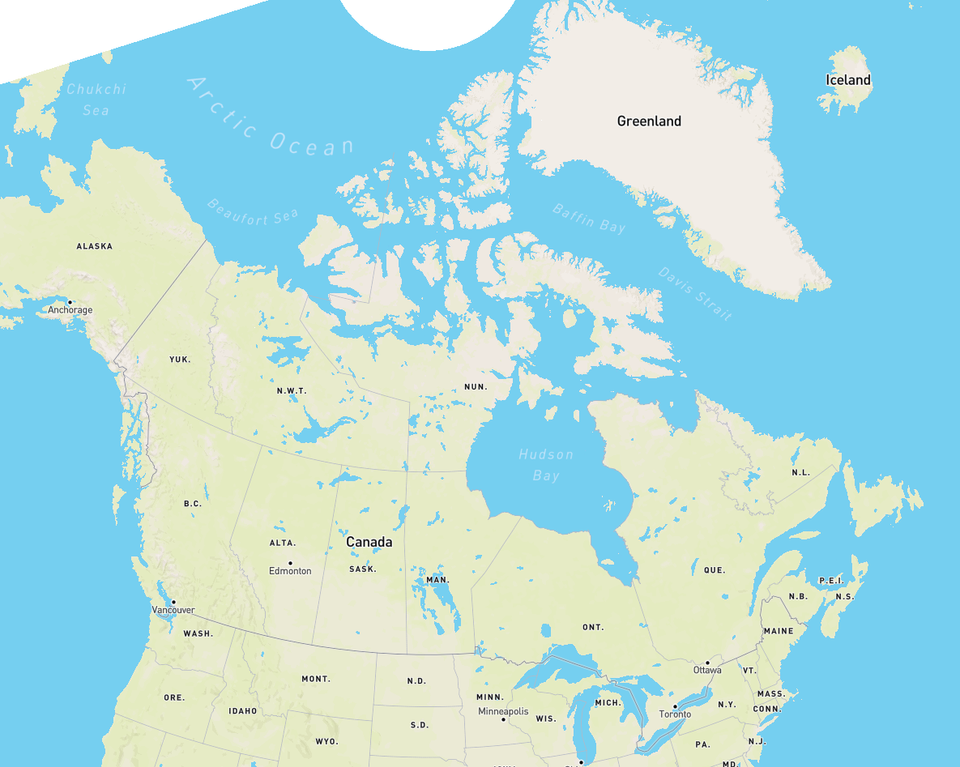
Notably, on a more regional/local level, they also have support for Lambert conformal conic which can also be modified to best represent the area of interest.
Keep in mind that Mapbox is not open source and to use these, we need to register with the company to get an access token. Therefore, we shall move on to what truly open source solutions offer in terms of projections.
As mentioned earlier, Leaflet is restricted to web mercator, and I think this is not going to change.
For MapLibre we’re left with mercator and globe projection out of the box, but there is an initiative by Pirmin Kalberer to provide support for Equal Earth for low zoom levels.
All these projections are set at map creation time, and, with the exception of using the globeControl button provided by MapLibre are not easily changed, unless you know some JavaScript.
In an ideal world the map would automatically be projected to a suitable (as there never is a best) projection based on the current view/extent/zoom of the map, hence, reacting to user input whenever the map is panned and zoomed. Inspired by Pirmin Kalberer’s post, I have implemented a little js function to change the MapLibre map from webmercator to globe view whenever the center latitude of the current view is beyond -60/60° North/South. Note, that MapLibre allows for interpolations, so the view is interpolated between (-)60° and (-)65° so if you pan and zoom around carefully, you will be able to see this interpolation. Let’s have a look
Summary
Right, in summary, my thoughts on the current state of the base(maps) of webmapping are as follows:
- MapLibre is currently the best option as an open source webmapping library, though Gleo certainly has a wealth of features and is worth investigating further.
- the ability to style and query vector tiles on-the-fly makes them much more useful as basemaps than raster tiles, though more open access styles would be great.
- having the possibility to switch between webmercator and globe view is great, but other (global) projections, such as equal earth would be useful.
- the ability to change projections on-the-fly in response to zooming and panning is awesome, though, as implemented in this document, has some performance issues.
Outlook
In Part II we will look at data overlays and how to transfer large data quickly and efficiently onto a webmap.
